"I used to spend too much time cleaning up slides just to explain one idea. With MakeCharts, I can turn rough notes into something the team gets in a few minutes."
MakeCharts - Free Online Chart, Diagram & Visual Maker
Turn Complexity Into Clear Visuals.
Make charts, diagrams, and plans people instantly understand.
From rough ideas to polished visuals, MakeCharts helps you build charts, timelines, maps, and frameworks fast. Explain data, workflows, and strategy without wrestling with design tools.
Chart Types for Every Idea
88 Chart Types, 401 Tools, 696 Templates
From rough ideas to polished visuals, MakeCharts helps you build charts, timelines, maps, and frameworks fast. Explain data, workflows, and strategy without wrestling with design tools.
All Chart Types
Chart Types for Every Idea
Pick the right visual to analyze, explain, or align - from data stories to planning workflows.
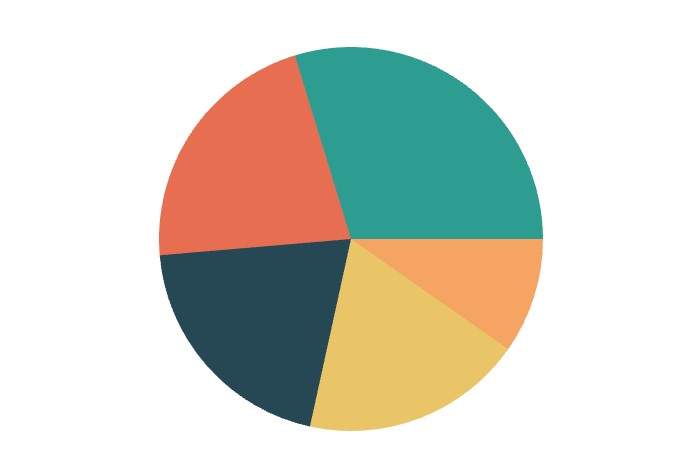 Pie Chartpie
Create a pie chart online in seconds with our free AI-powered Pie Chart Maker. Visualize proportions, budget splits, and share data — no sign-up needed.
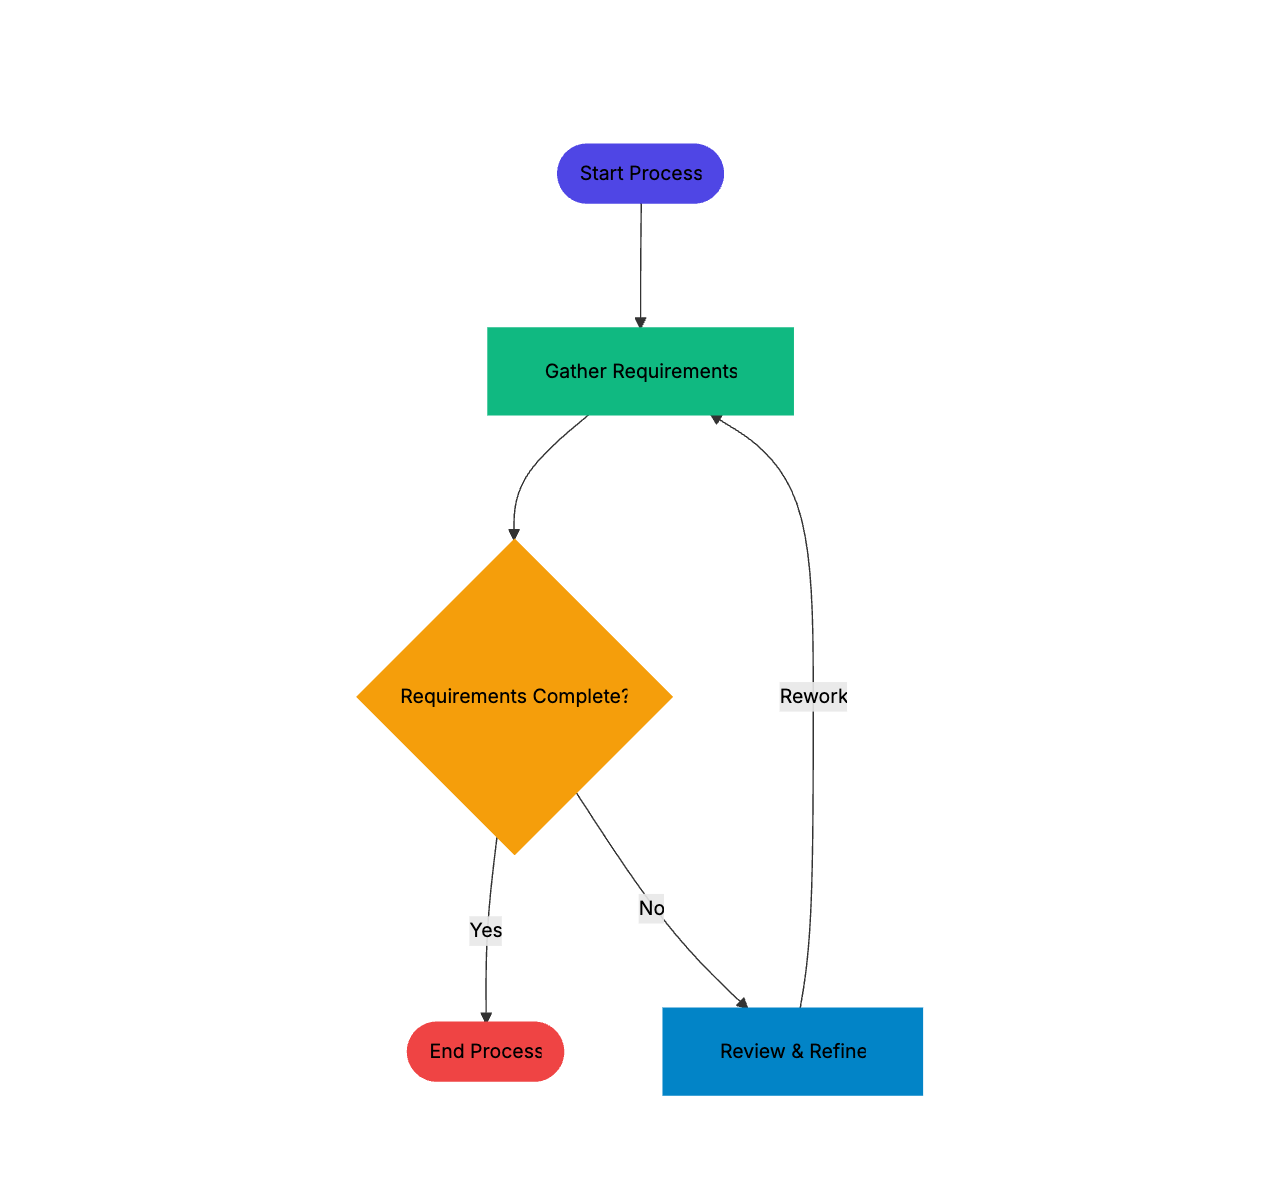 Flowchart Chartflowchart
Build free flowcharts online with AI. Visualize processes, decisions, and workflows in seconds — no sign-up needed. Try MakeCharts' free AI flowchart generator.
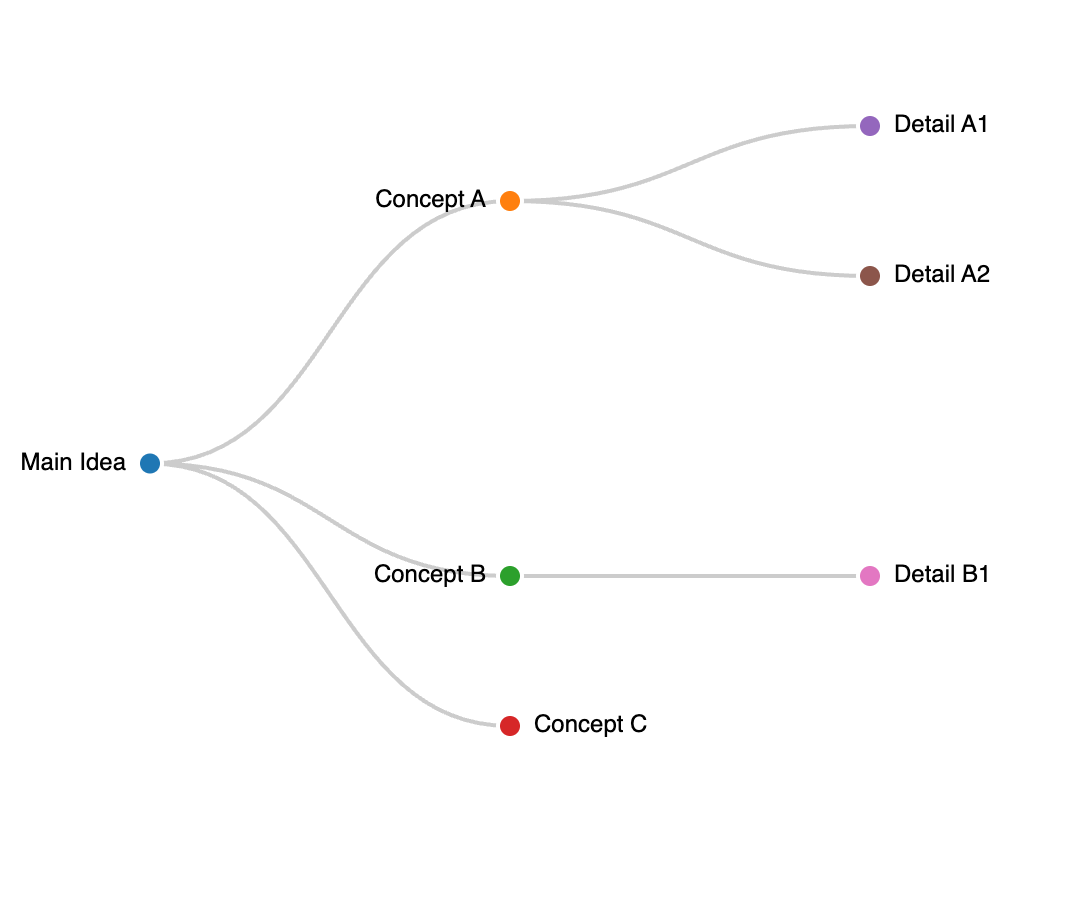
 Concept Chartconcept
Create concept charts online for free with AI. Map ideas, relationships, and knowledge structures visually. No sign-up required — start now on MakeCharts.
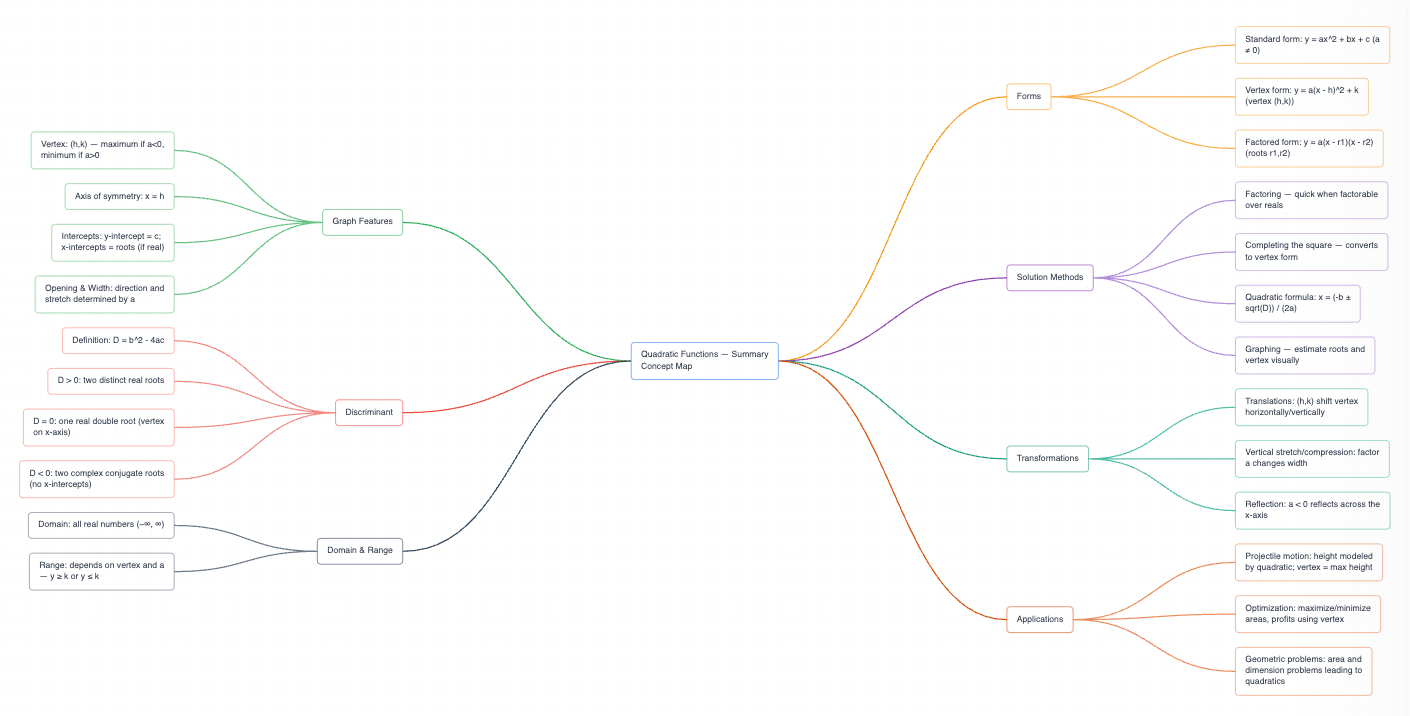
 Mindmap Chartmindmap
Create mindmap charts free online with AI. Visualize ideas, brainstorm topics, and map complex concepts instantly — no sign-up or download needed.
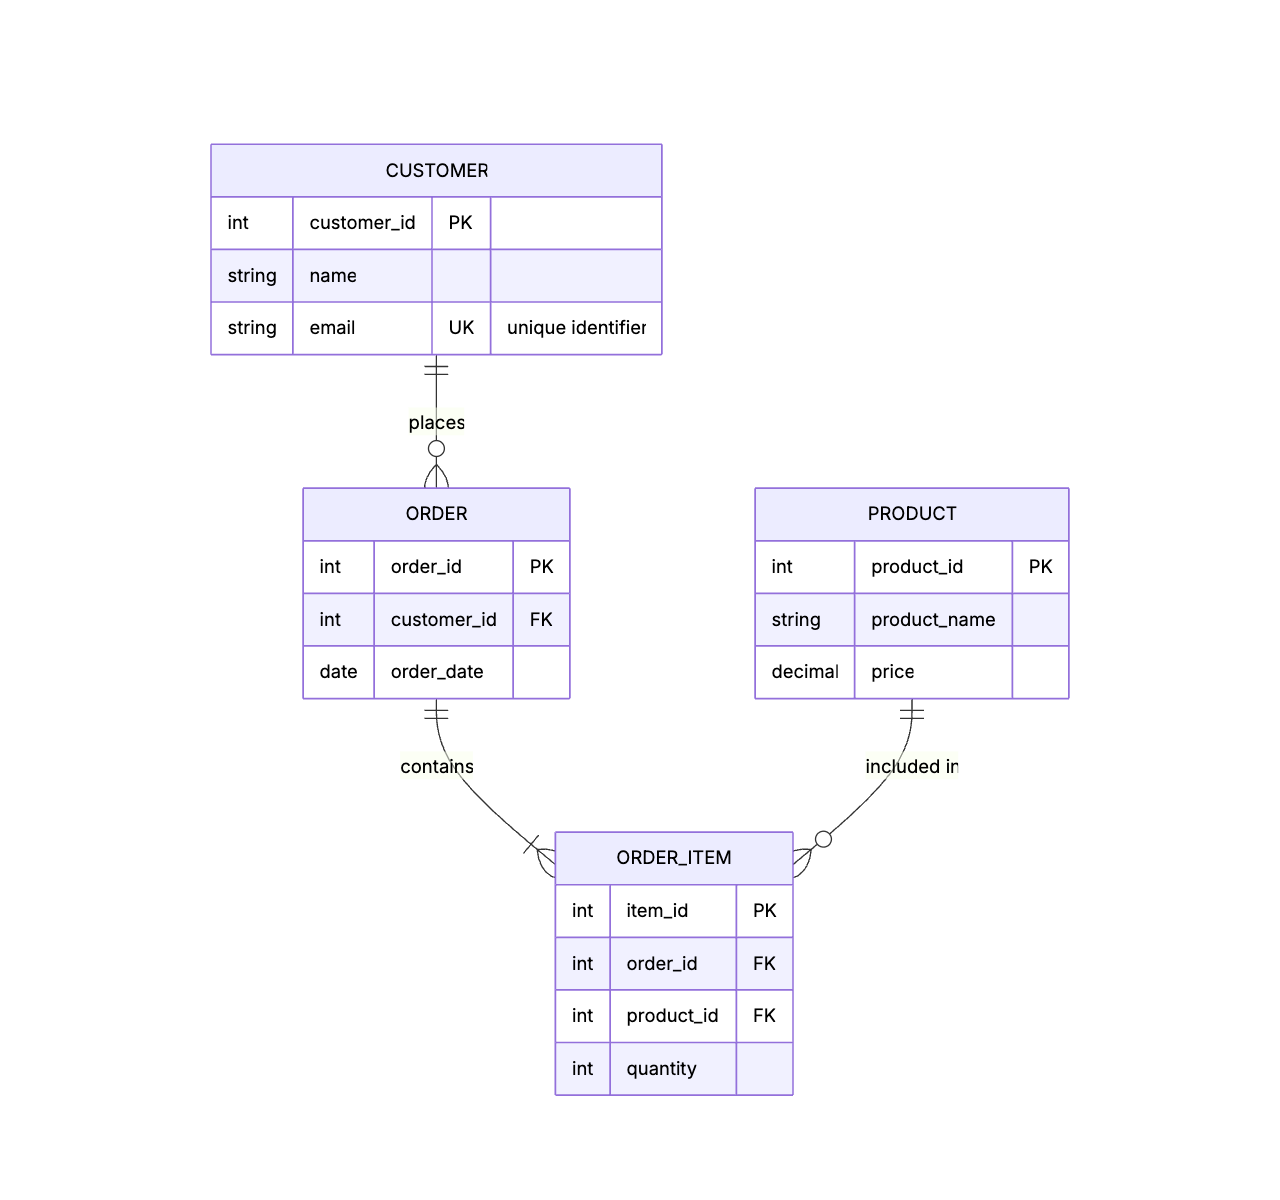 ERD Charterd
Create entity relationship diagrams free online with AI. Map database schemas, define table relationships, and document your data model — no sign-up needed.
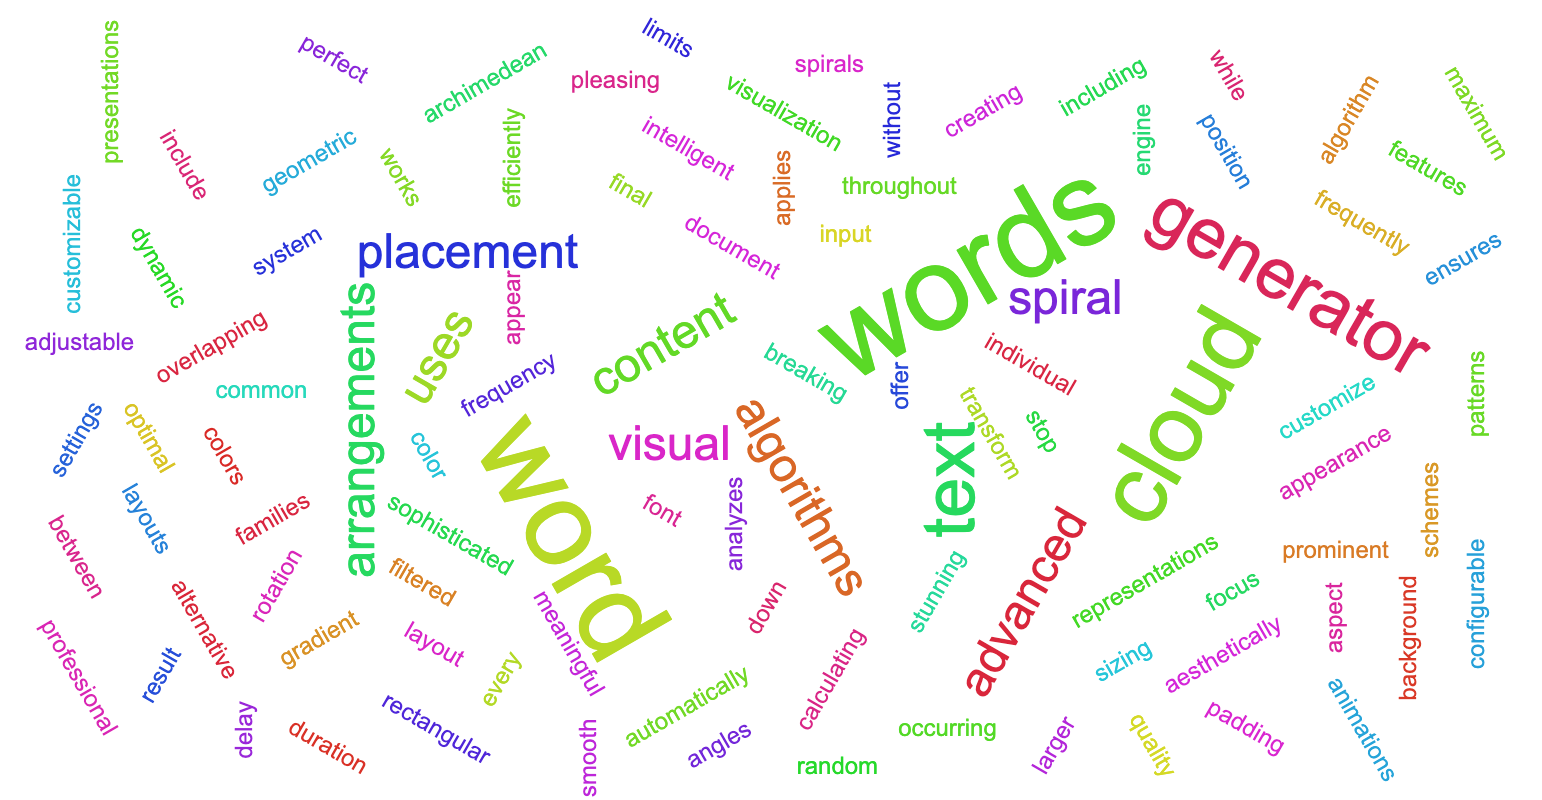 Wordcloud Chartwordcloud
Create word cloud charts free online with MakeCharts. Paste any text or describe your data — our AI wordcloud generator visualizes word frequency in seconds.
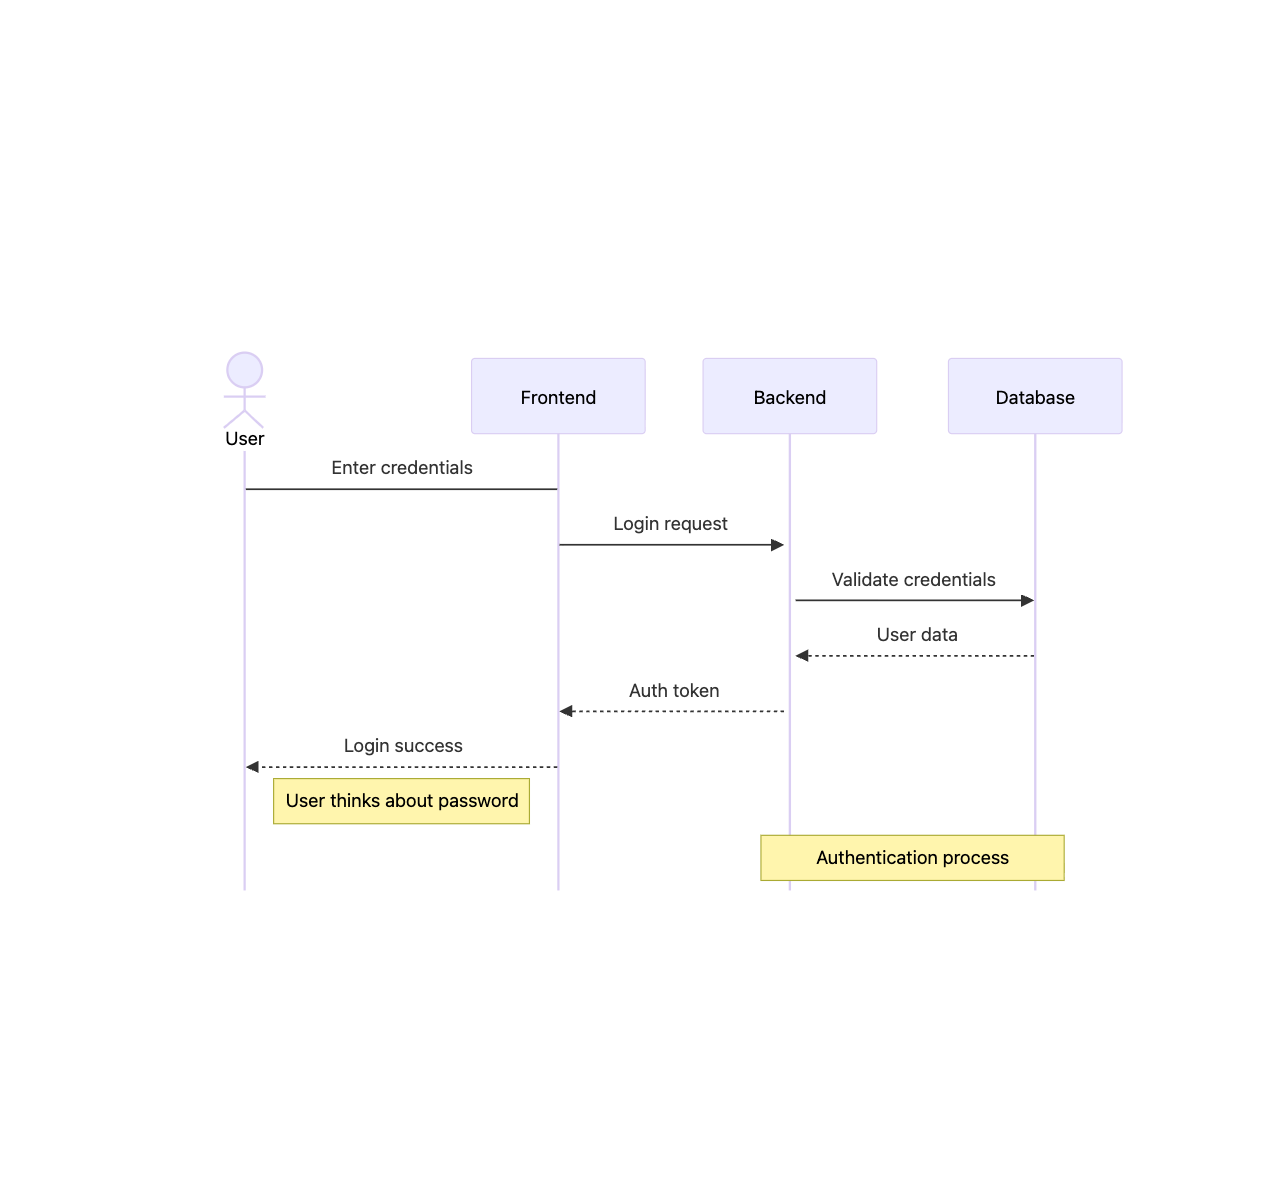 Sequence Chartsequence
Create sequence diagrams free online with MakeCharts. Visualize interactions, system flows, and API calls with our AI sequence chart generator. No sign-up.
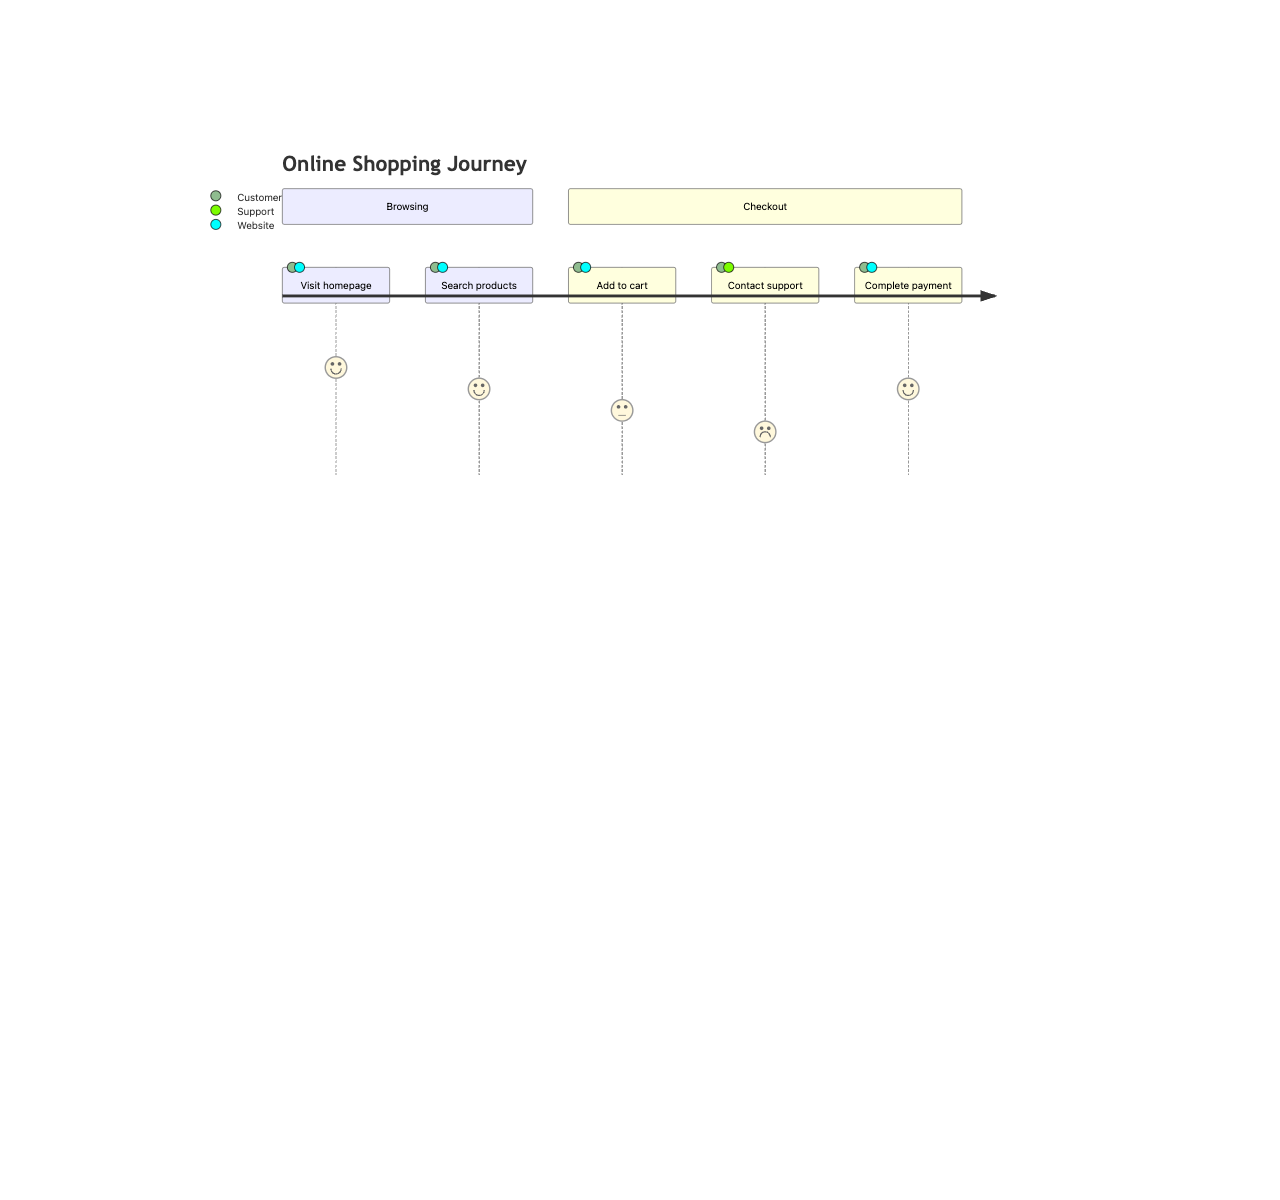 User Journey Chartuserjourney
Create a user journey chart free online with AI. Map customer touchpoints, tasks, and satisfaction scores instantly — no sign-up, no download needed.
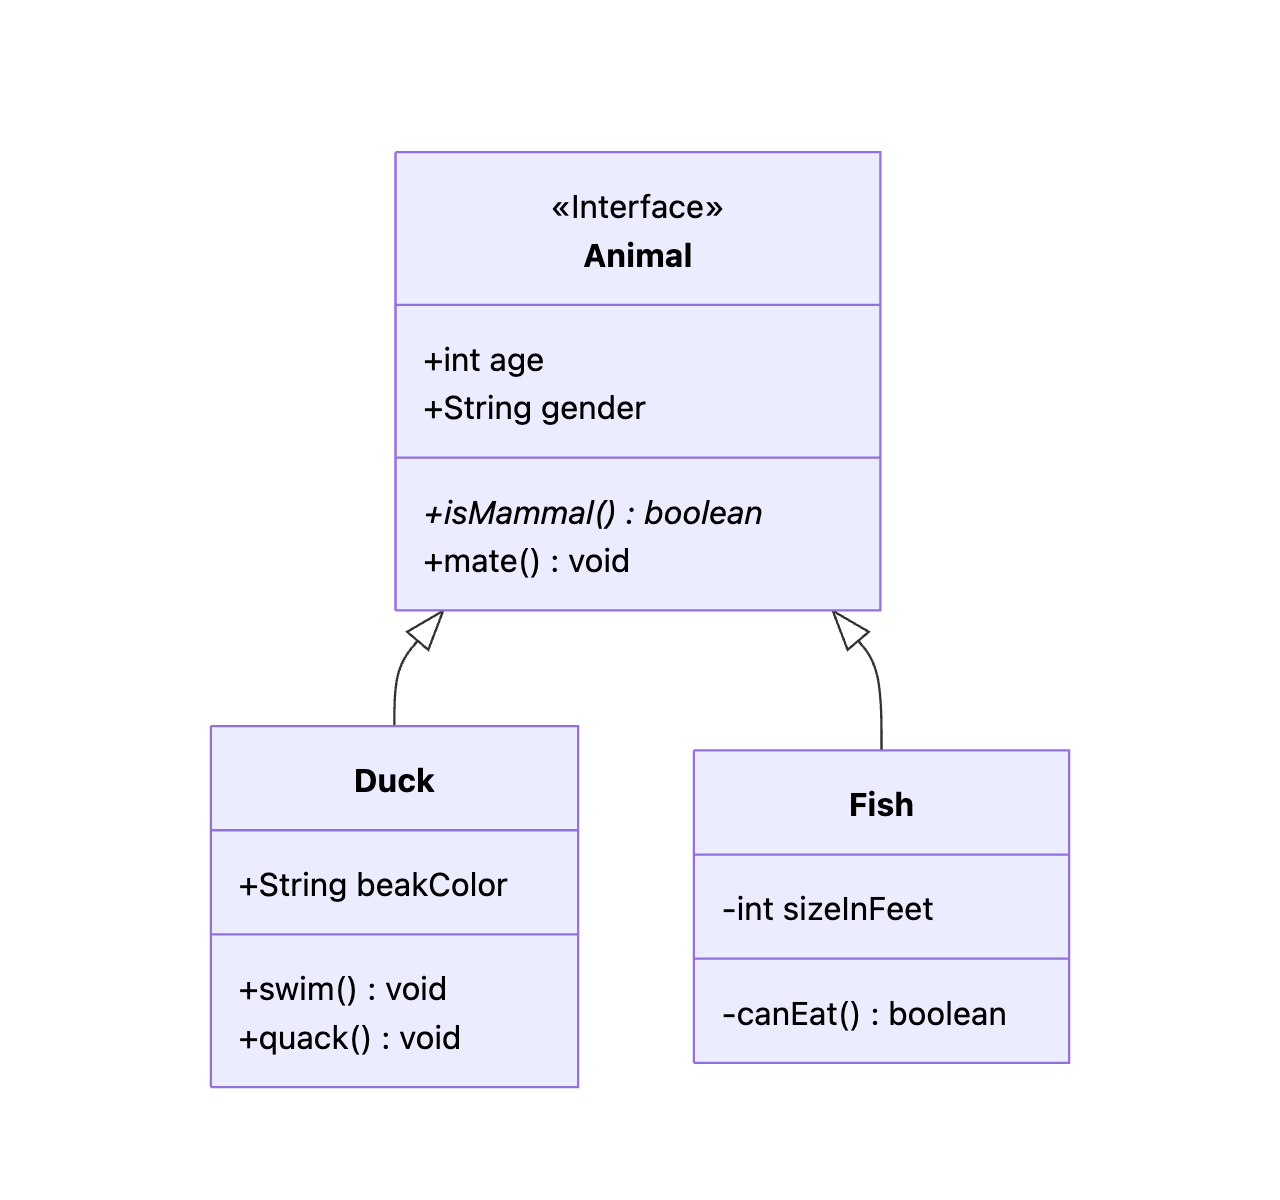 Class Diagramclassdiagram
Create UML class diagrams free online with AI. Define classes, members, and relationships instantly. No sign-up needed. Try the AI class diagram generator now.
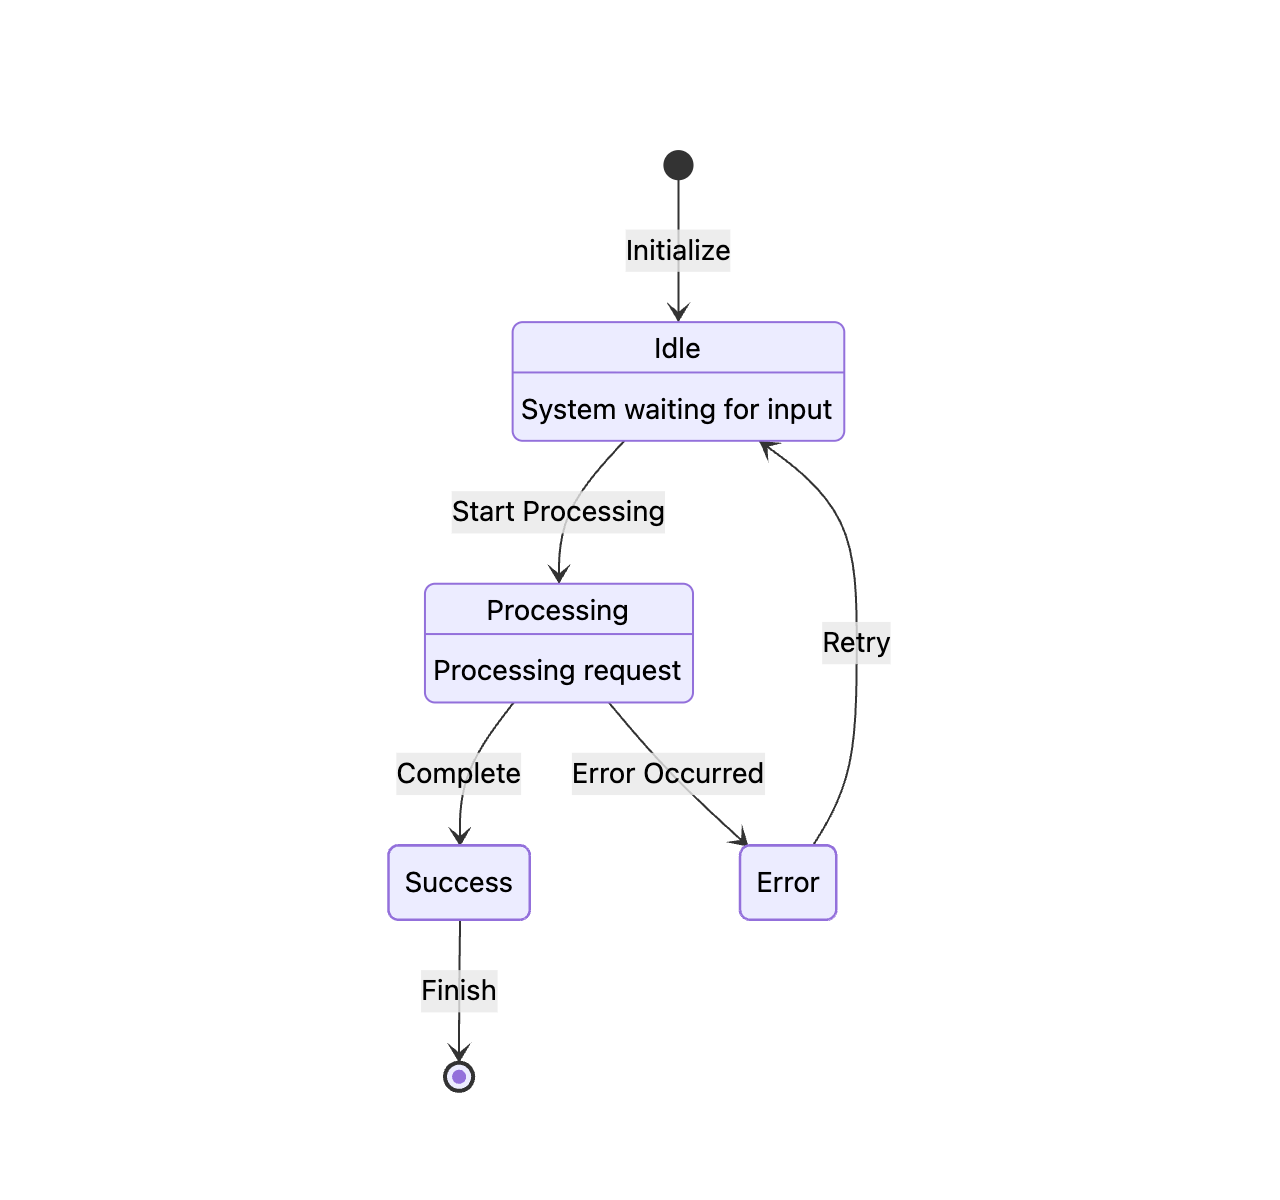 Statediagram Chartstatediagram
Create free state diagrams online with AI. Map system states and transitions instantly. No sign-up needed, no downloads — just describe and generate.
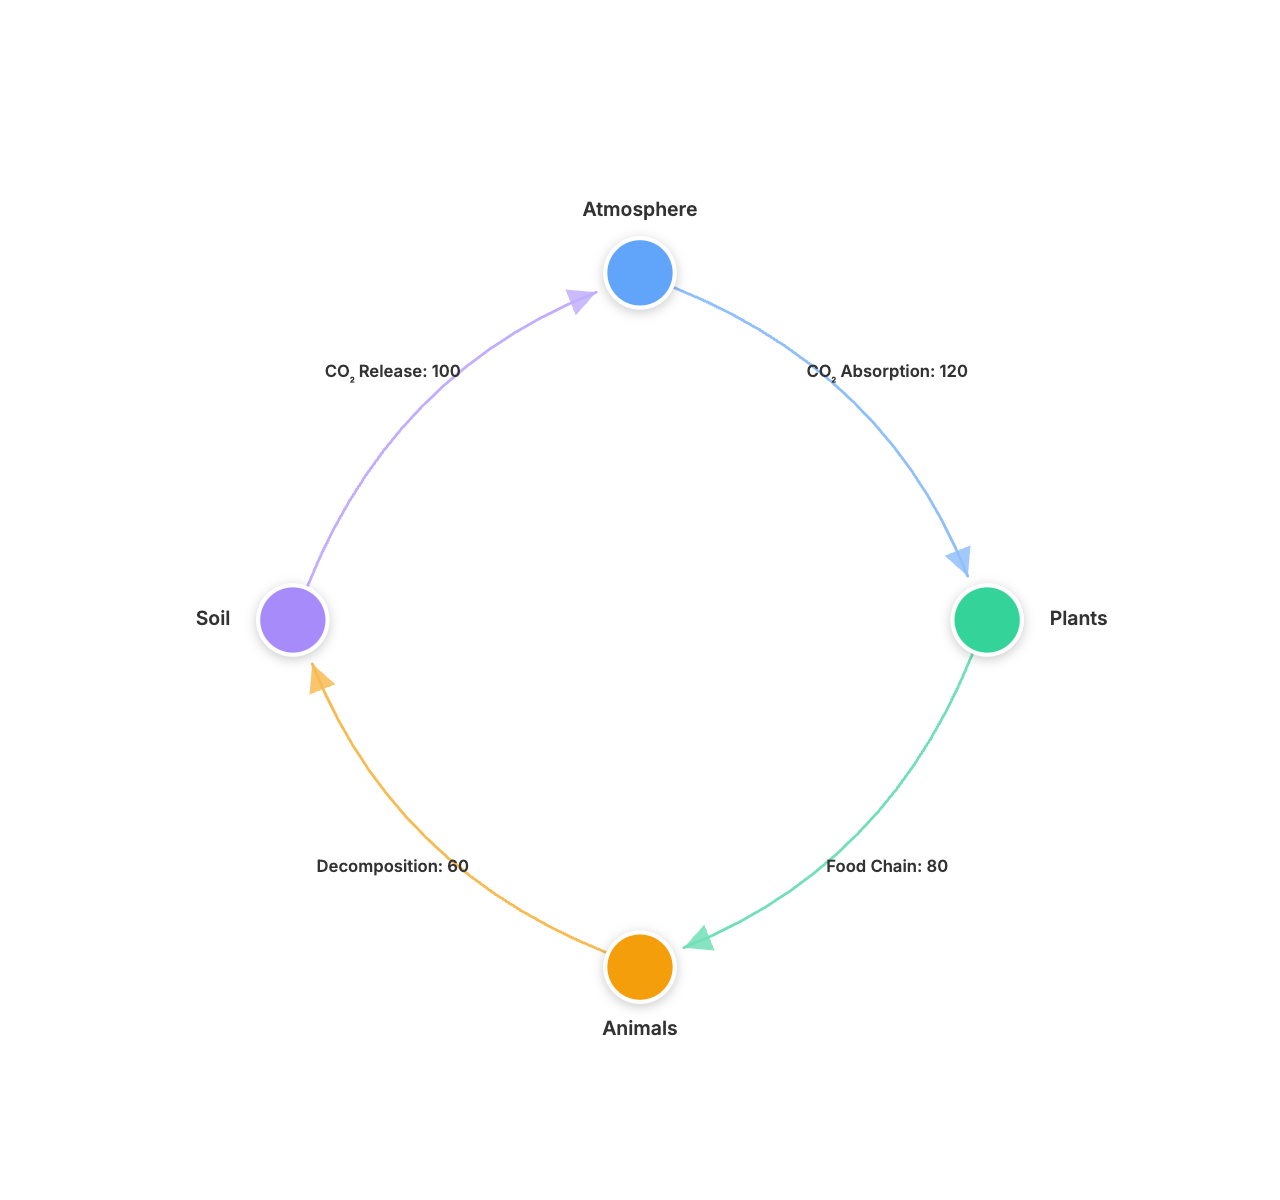 Circular Diagram Chartcircular-diagram
Create circular diagram charts free online with AI. Visualize cyclical flows, ecosystems, and circular processes in seconds. No sign-up needed.
 Outline Chartoutline
Create outline charts free online with AI. Visualize hierarchies, project phases, and nested structures instantly — no sign-up, no downloads required.
 Line Chartline
Create line charts online in seconds with AI. Track trends, visualize time-series data, and share beautiful charts — free, no sign-up needed.
 Bar Chartbar
Create bar charts online for free with our AI chart generator. Compare categories visually, download as PNG or SVG, and share — no sign-up needed.
 Area Chartarea
Create stunning area charts online in minutes. Visualize trends, compare multiple data series, and customize colors, curves, and legends. No skills needed.
 Venn Chartvenn
Create a free Venn chart online in seconds. Use our AI-powered Venn chart maker to visualize overlaps and relationships between sets — no sign-up needed.
 Radar Chartradar
Create a radar chart online for free using AI. Compare performance, skills, and stats across multiple categories instantly — no sign-up required.
View All88 Chart TypesExplore all chart types and visualizations
Loved by Creators
Teams use MakeCharts to explain insights, share ideas, and align plans with visuals.
"I reach for it when a process lives in my head and needs to make sense to everyone else. Flowcharts and timelines come together fast, and they actually look polished."
Marcus Lee
Operations Manager"We started using MakeCharts for roadmap updates, but now it is how we explain almost any messy project. It cuts down the back-and-forth."
Elena Torres
Program Lead"I am not a designer, and I do not want to become one at 11 p.m. before a review. This gives me clean visuals without all the fiddling."
Jason Miller
Startup Founder"The best part is how quickly people understand the point. I can drop one chart into a doc or deck and skip three paragraphs of explanation."
Sofia Chen
Research Lead"It feels built for real work, not just pretty diagrams. We use it for org charts, planning maps, and quick visuals when a spreadsheet is not enough."
David Kim
Chief of StaffFrequently Asked Questions
Frequently Asked Questions
What makes MakeCharts different from other chart tools?
MakeCharts is built for visual expression, not just data. It gives you charts, diagrams, and planning visuals in one place so you can explain ideas as clearly as you present numbers.
Can I use it for planning and communication, not just analytics?
Absolutely. Many teams use MakeCharts for roadmaps, workflows, org charts, and strategy maps to align stakeholders quickly.
How do I share or export my visuals?
Export to PNG, SVG, or PDF for decks and docs, or drop visuals into your workflow to keep everyone on the same page.
Do I need design skills to make something that looks good?
No. MakeCharts gives you polished layouts and smart defaults, so your visuals look clean and professional without extra effort.
What kinds of visuals can I create?
Everything from classic charts to diagrams, mind maps, timelines, and flows. If it helps explain an idea, you can likely build it here.
Start Free
Bring Clarity to What You Know.
Turn data, ideas, and plans into clear, shareable visuals in minutes. Start free.
Start Creating Free